ROI Recipe
Leverage Journey Stages to Accelerate Pipeline
Overview
Journey Stages depict how an account moves through an account-based marketing (ABM) journey: the customer’s path from initial awareness to final purchase (and beyond). While the more “old school” sales funnel is company-centric — focused on the actions the company must take to move potential customers toward a sale, Journey Stages are buyer-centric — focused on the buyer’s decision-making process and their experiences as they interact with a brand or product.
When properly implemented, Journey Stages serve as a diagnostic tool for determining how different tactics influence results to help you see where accounts might be getting “stuck” in the journey and employ tactics to help drive them forward. You can even compare results for accounts receiving an ABM approach vs. a demand gen approach to evaluate success.
Ingredients
- Journey Stage Analytics
The Journeys summary page in the Analytics section helps you measure how your target account lists are performing across each of your Journey Stages. You can also track key metrics such as Pipeline, Revenue, Close Rate, Average Deal Size, Volume, Conversion, and Velocity. By analyzing journey progression and revenue metrics, you can draw insights into Account-Based Marketing (ABM) strategies that maximize ROI. - Defined Program/Account Audiences (ABM and Demand Gen)
Your audiences are the different groups of accounts from your TAM that are delineated based on specific criteria and the strategy and tactics you apply to each of them. Which accounts are part of your ABM efforts vs. targeted demand generation plays?
Equipment
- Demandbase One™ ABX
Step-by-Step Instructions
Step 1: Configure/Review Journey Stages
Journey Stages should align with your marketing and sales funnel both pre- and post-sales
If you’re currently using the Demandbase Out-of-the-Box Journey Stages in your configuration, review the predefined criteria. You may want to customize some of the Stages and add others to accurately reflect how your team thinks about the different stages of the buying cycle.
If you’ve already customized your Journey Stages, review them once a quarter and make adjustments as changes in your product, commerce space, and business goals warrant.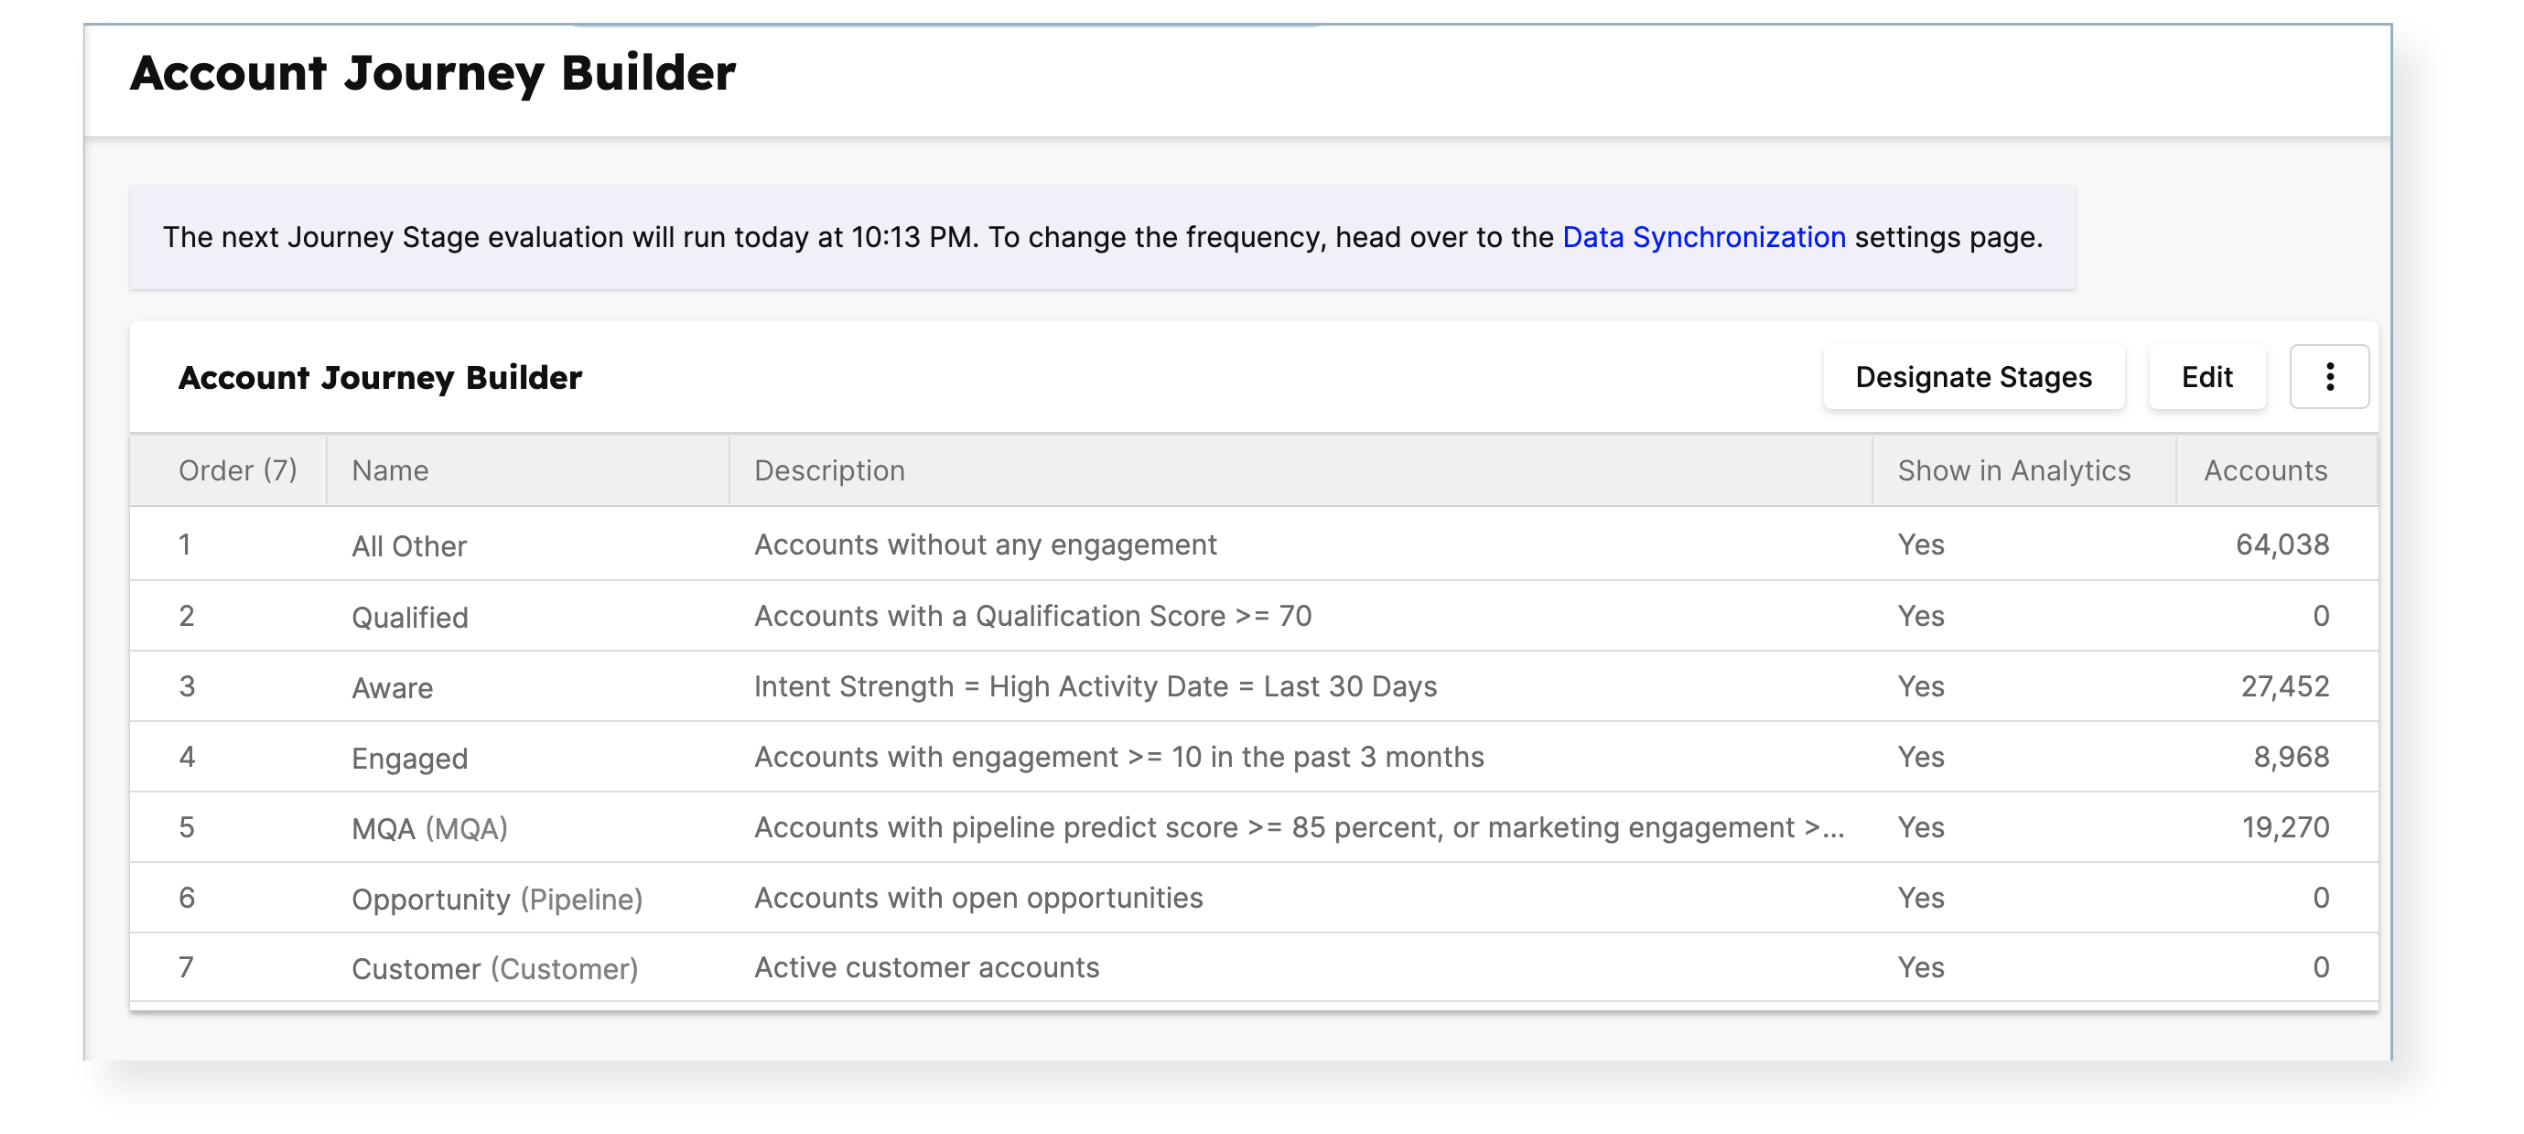
Out-of-the-box Journey Stages in DB1
Learn More
Video
Working with Journey StagesArticle
Getting Started with Journey StagesArticle
Best Practices for Customizing the Account JourneyArticle
Journey Stage FAQs
Step 2: Designate Benchmark Journey Stages
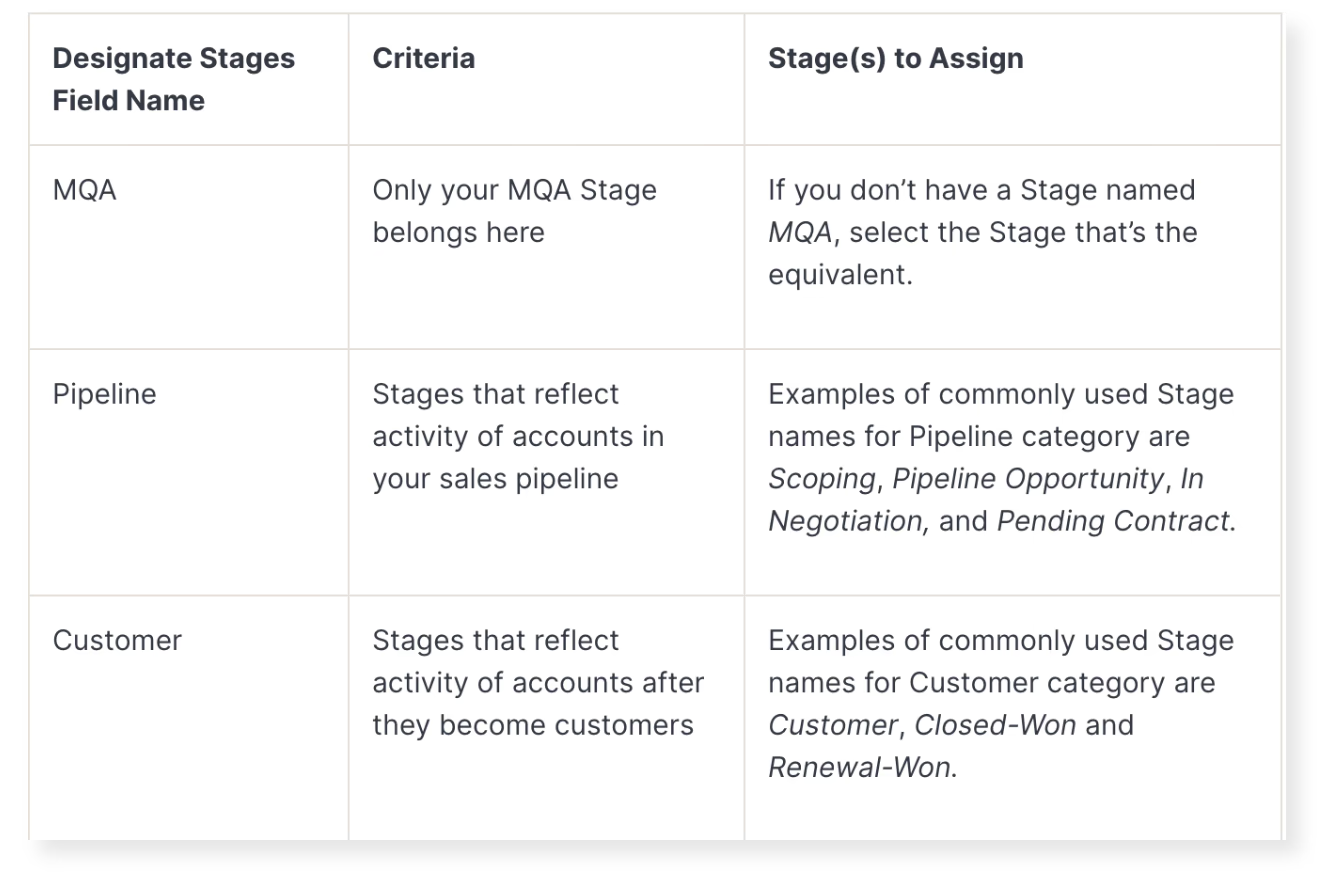
Align your Journey stages with three key milestones of the Account-Based Marketing Journey: MQA (Marketing Qualified Account), Pipeline, and Customer.
Designating these benchmark stages will ensure you can accurately measure key metrics in Journey Analytics.
Tip: Don’t expect to assign all Stages in the Designate Stages window. Most Stages before Pipeline don’t get assigned in the Designate Stages fields.
Learn More
Step 3: Build lists that reflect your Account or Program Audiences
Build a list for each of your account audiences. At Demandbase, we tier our accounts based on desired business outcomes. For each tier, we apply different strategies and approaches, which we’ll want to compare. For example:
- ABM 1:Few (Tier 1)
- ABM 1:Many (Tier 2)
- Targeted Demand Gen (Tier 3-4)
Repeat this process to build out lists for each of your Account Audiences.

Learn More
Step 4: Measure: KPI and Journey Metrics
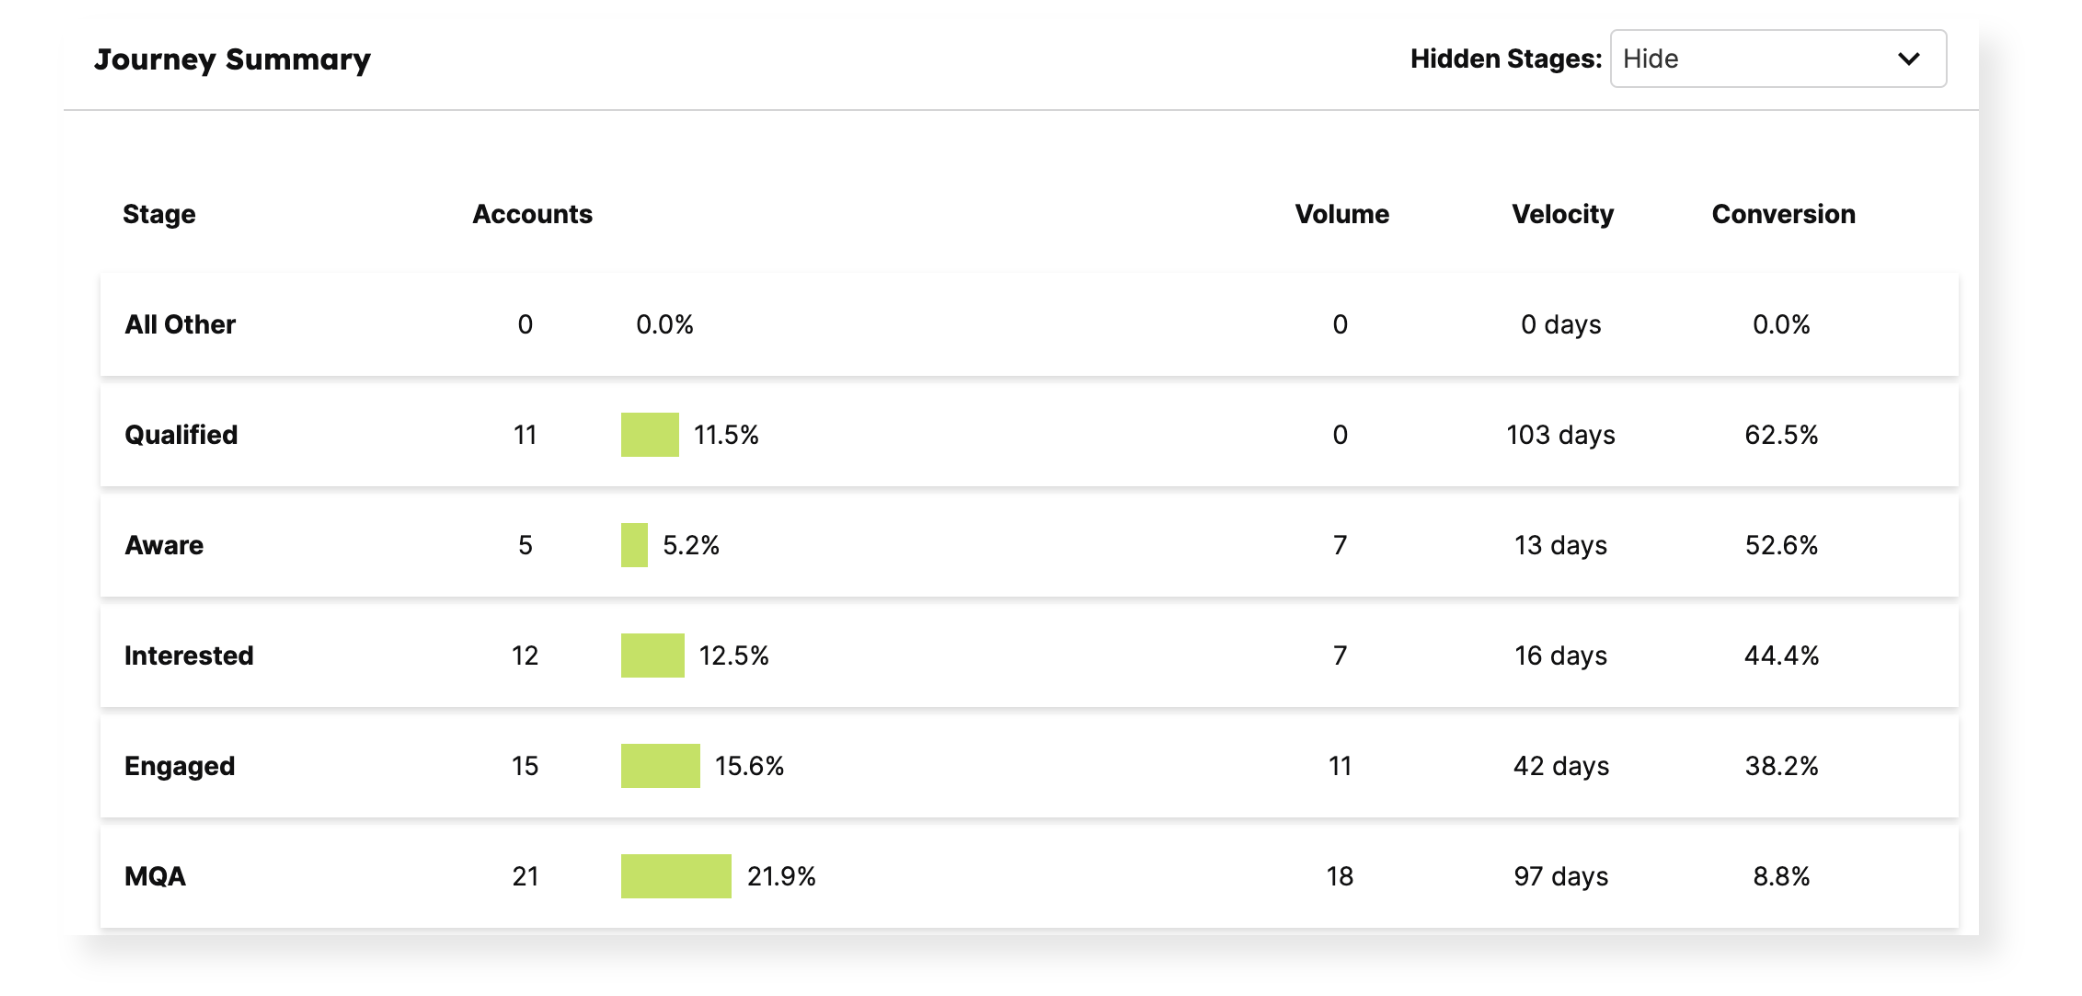
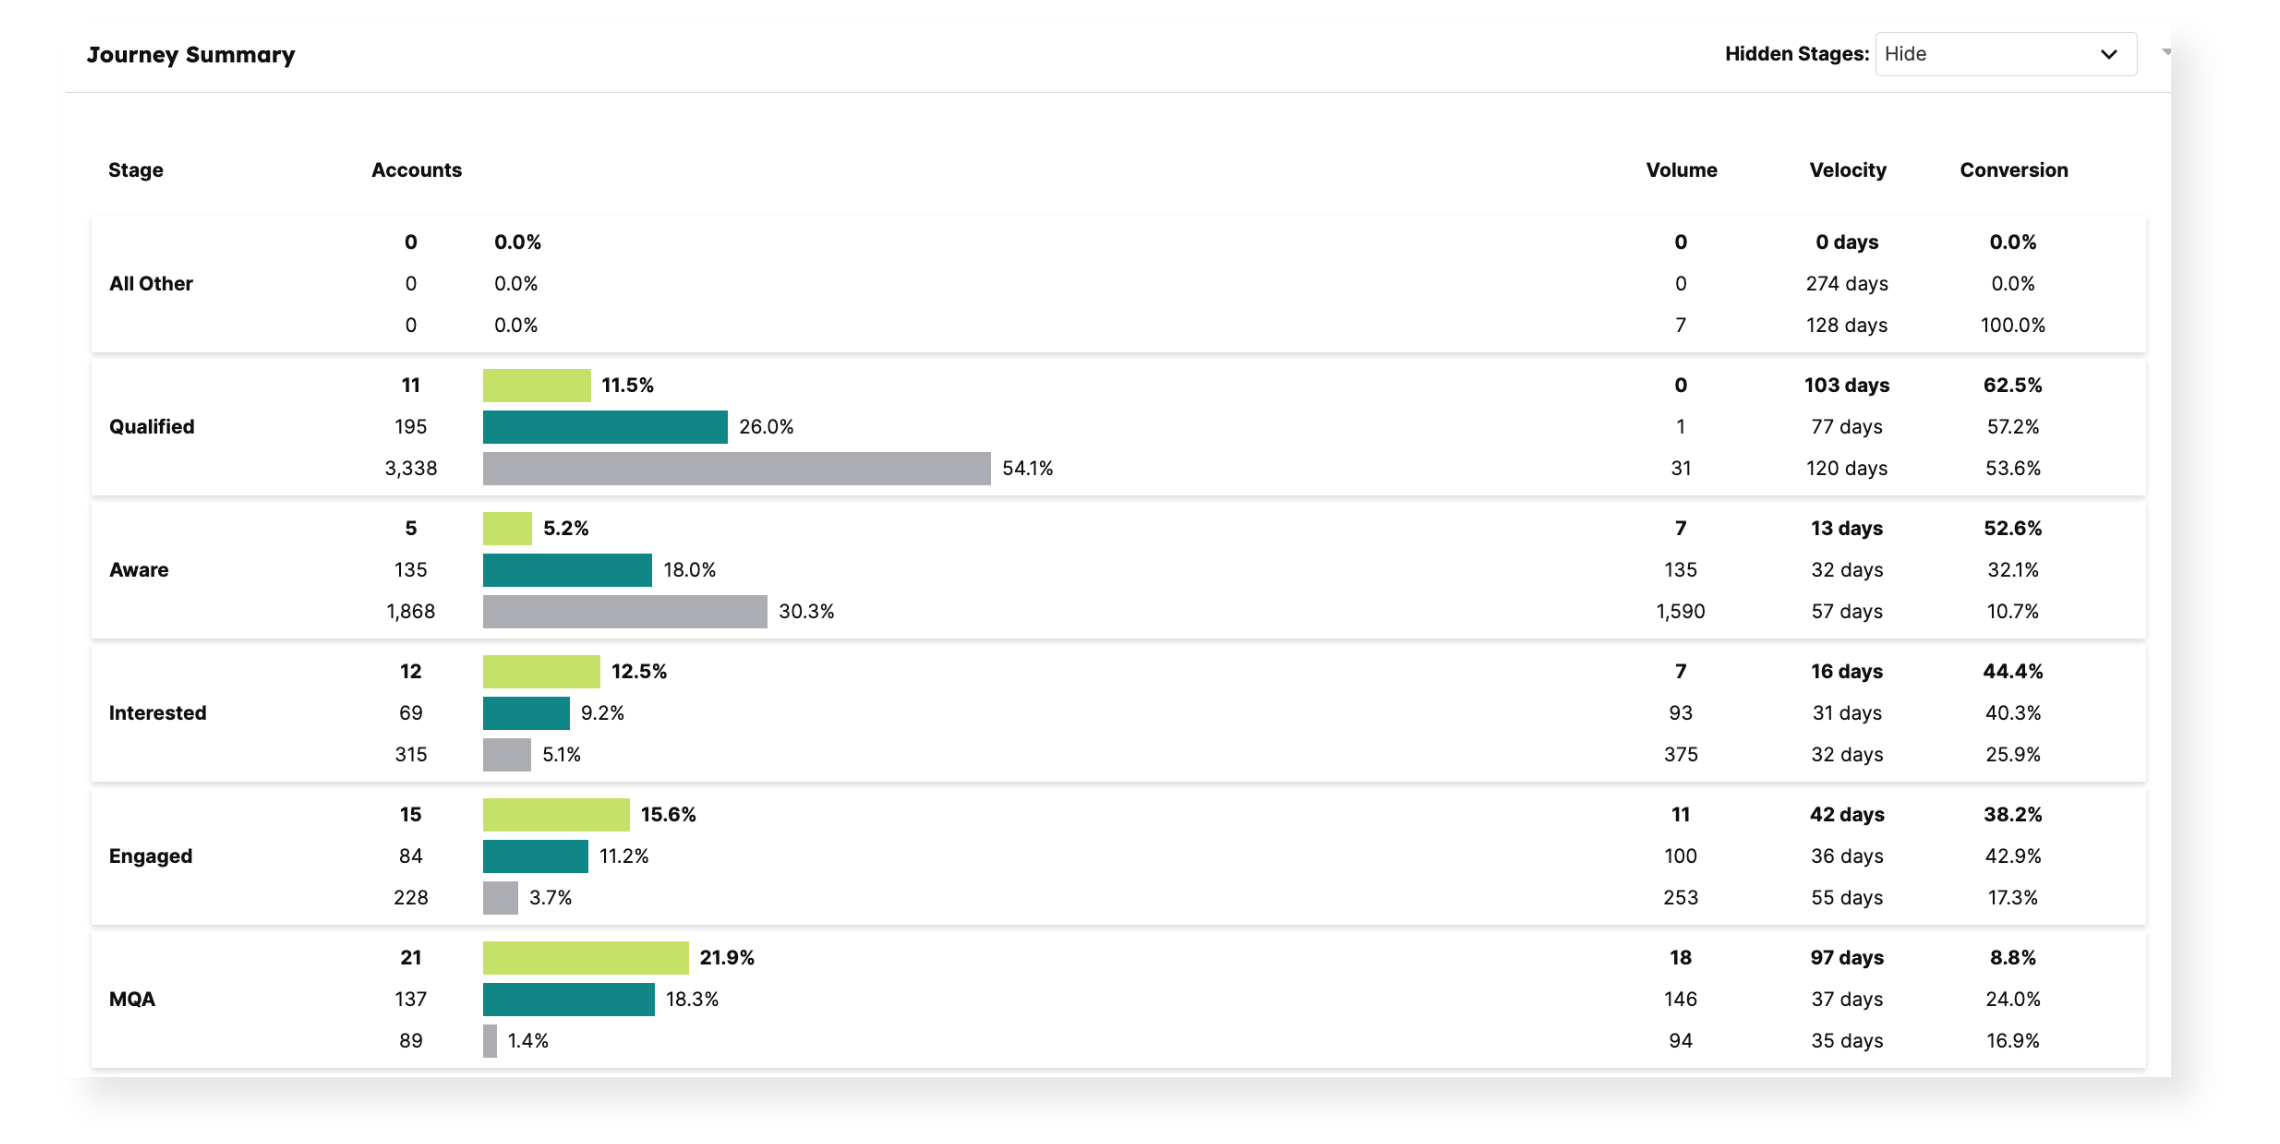
Measure the performance of each audience on the Journey Summary page in Analytics.
After you select an account list, you can use the date range selector and quick filters at the top of the page to update the data shown.
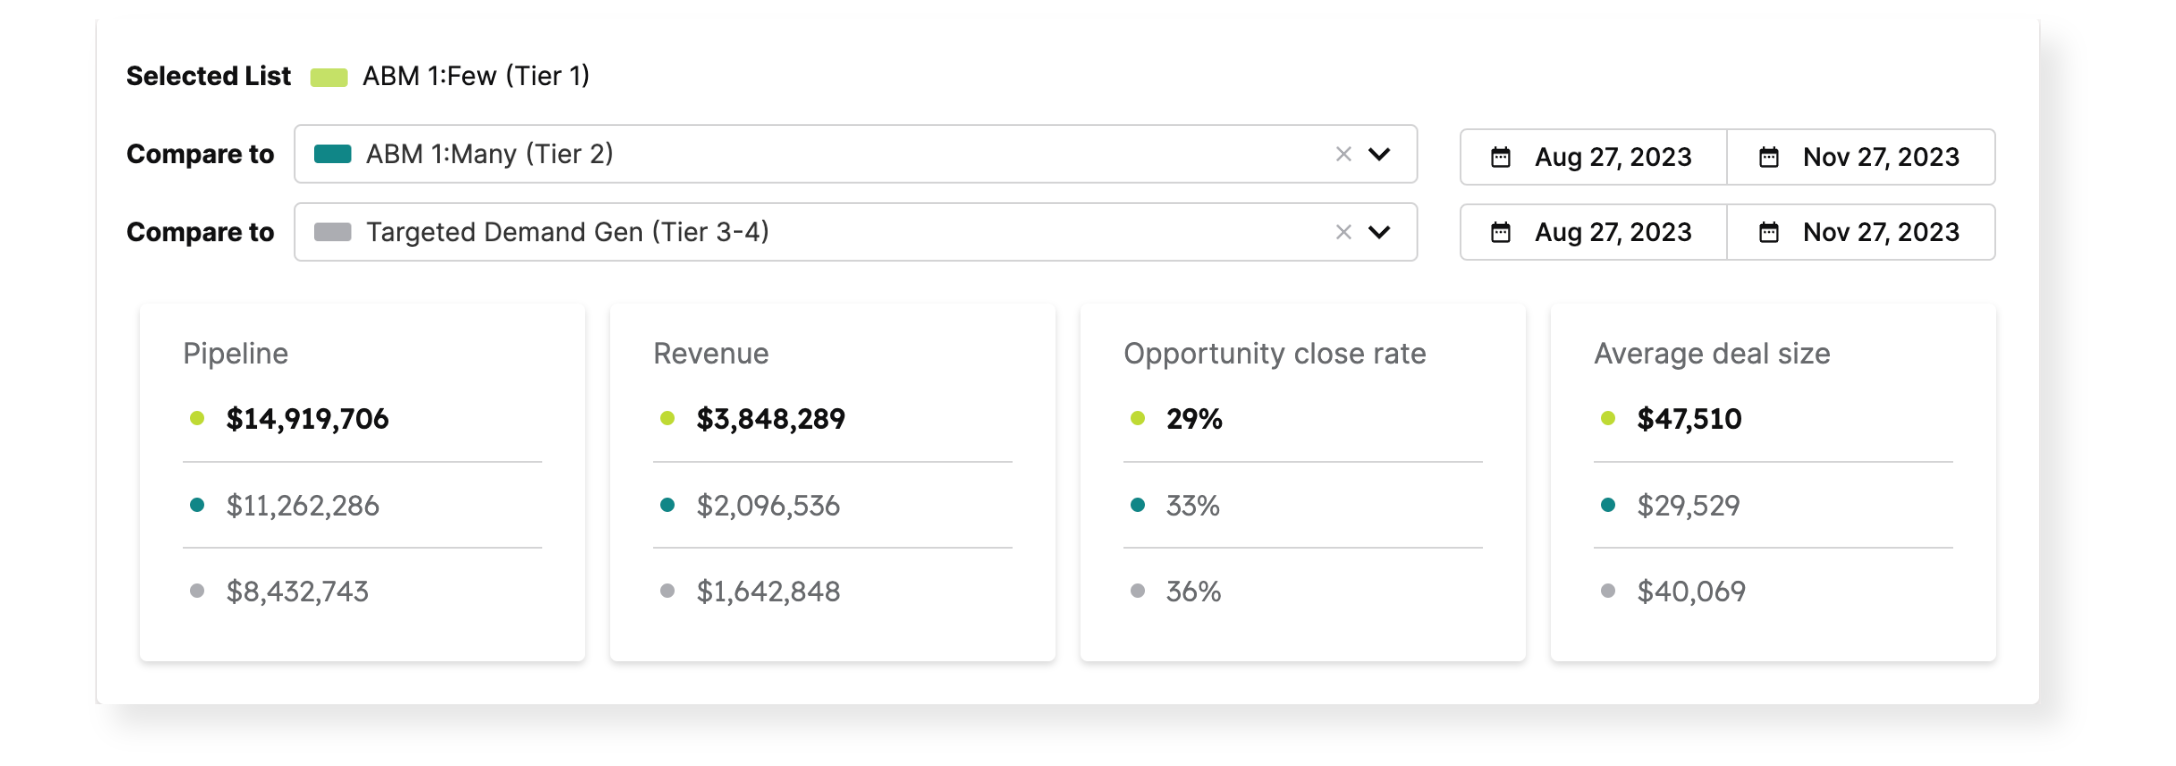
Track KPI metrics related to opportunities: pipeline, revenue, opportunity close rate, and average deal size.
Evaluate the number of accounts that have moved from one Journey Stage to a future one, how quickly they moved from stage to stage, and how many converted to further stages.

Learn More
Step 5: Measure: Compare Results
Part of measuring results is comparing them against various account lists to determine how different tactics, messaging, and spend influence results.
Compare your account lists using Journey compare mode on the same Journeys Summary page from Step 4. You can select up to 4 lists at a time.
What do you notice? Is there one group that performs better than another across all measurements?
These insights are key to optimizing your efforts, evaluating success, and maximizing ROI.
Learn More
Chef Tips & Tricks
- Journey stages don’t end at close-won. Define journey stages related to customer upsells.
- Use Journey Compare mode to compare stage data for 2-3 accounts list the same list over time.
- Only implement Stages that represent meaningful milestones (sort of a “less is more” approach). A loose rule-of-thumb is to include no more than nine Stages in the Analytics view of Journeys.
- Don’t try to align your Journey Stages with your Salesforce Opportunity Stages.
- Review your Journey Stages once per quarter to ensure they still align with your Go-To-Market strategy.
Check out more recipes!